Fundamentals in Business Process Management28th of Januari 2017This book was developed because the authors felt there was a lack of good study materials for BPM, and thus is aimed at use in academic pursuits. This is further identified by the presence of exercises in each of the chapters. The book (or at least several of its chapters) is a requirement for the OCEB 2 Fundamental and Intermediate exam by OMG, where the introductory chapter and the chapters on process identification and automation are highlighted as especially relevant. All course material associated with this book is consultable online. The first chapter is an introduction of Business Process Management, and thus is mostly a recap of the things already known by most practitioners of the discipline. It states that BPM is the art and science of overseeing how work is done within an organization in order to get consistent (repeatable) outcomes and to take advantage of improvement opportunities. It points out that BPM is not about improving individual tasks, but rather about managing the chain of activities, decisions and events (also known as a process) that add value to an organization and its customers. It offers a rather generic definition of the business process as follows: |
 |
The definition of Business Process Management (which is not so different from the definition given in the “Passports to Success in BPM” book) is strictly coupled to the BPM lifecycle, and then becomes:
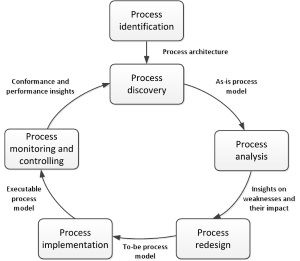
The chapter then dives into the BPM lifecycle, as shown in the illustration. Each of the following chapters will take up one of the steps in this lifecycle. It is very close to the lifecycle I myself employ, but I add several steps, such as a decision point of Business Process Outsourcing, and disposing of a defunct process. One point of attention is that the process architecture is stated to take form during process identification as a collection of processes and links between them representing a type of relationship. My stance on architecture is that it encompasses much more than just the formalization of the different discovered processes, and should act as a guiding force throughout the entire lifecycle, and preferably also taken in by the centre of excellence as input for future BPM projects. But I should take the semantic approach and differentiate between the process architecture (only about the functional process categorization) and the overall solution architecture.
The final introduction point is a listing of the different stakeholders that are typically present in the BPM lifecycle. These consist of the management team (represented by a C-level executive), process owners who take responsibility for efficient execution of a given business process, the process participants, the process analysts, the system engineers who are involved in the process redesign and implementation, and a BPM centre of excellence overseeing the BPM projects and preserving lessons learned from previous projects.
Chapter 2 is goes into detail about the Process Identification step of the lifecycle. It sketches the playbook in two phases by which to systematically define the different processes in an organization (Designation Phase) and how to decide on clear criteria for prioritizing them (Evaluation Phase). The output of this step will be the process architecture. Most organization will however not have the resources to go through a Process Lifecycle for each of their processes (and in fact it would not be very cost effective to do so), and should limit this exercise to the key processes.
At the very beginning of turning an organization into a process-centered organization, the difficulty of finding a meaningful enumeration of the business processes might be daunting, especially when the hierarchy of processes comes into play. Which processes are main processes, and which are just supporting them? Also the granularity of the processes should be taken into account. Drawing up a process that covers half the operations of an organization would be complex and time-consuming. The smaller the number of processes the bigger their individual scope becomes. Thus the number of processes identified in the Designation Phase should represent the tradeoff between impact and manageability. Process categories such as the Porter Value Chain used in the Process Classification Framework of APQC or Supply Chain Operations Reference Model (SCOR) can be used to this effect.
After the identification of these meaningful processes, their Evaluation Phase will determine the amount of attention (commitment, ownership, investment in performance enhancement, optimization) each of these is afforded based on a number of criteria: importance (or strategic relevance), dysfunction (assessing the “health” of the process, or the level of need for optimization) a feasibility (or susceptibility to process management). Which of these criteria are to be considered over others, and whether there are others, depends largely on the sort of enterprise doing the process management.
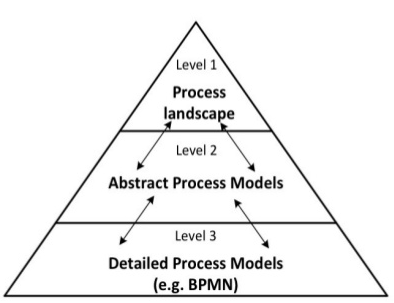
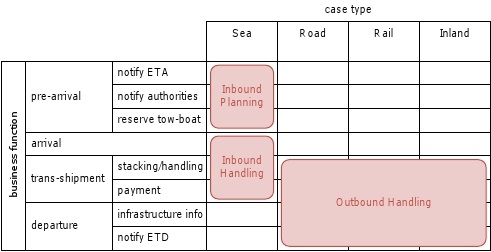
The resulting process architecture can be described as a conceptual model showing the processes of a company and their relationships towards each other. This architecture is described in different levels of detail, as shown in the illustration. The first level (process landscape) needs to detail the processes so that they are understandable to all stakeholders, and the list should be sufficiently complete so that all stakeholders can relate the landscape with their daily work. The aim here is to limit the number of process categories to around 20. This can be done in different ways, but the book concentrates on the Dijkman approach of characterizing the level one processes on two axes: case type and function. An example of this (harbor authority) can be seen in the illustration next to the process architecture. The approach boils down to: identifying the case types, identifying the functions for these case types, constructing one or more matrices (case/function) and identifying the processes (red rectangles).
The level of functional decomposition per case type can be determined by two rules of thumb:
- The decomposition should make clear which functions are attributed to which organizational units or departments (with corresponding managers). No function should be part of two such units.
- The decomposition should take care to identify different functions for the different roles in each department.
There are several guidelines that can be employed to further split up the identified processes on the matrix, either based on the flow objects within the processes, logical separations occurring within it or some referential frame such as for example APQC’s Process Classification Framework. To complete the process architecture, we then need to flesh out the processes in order to get to know the various steps within the process and the organizational units involved to carry out those steps. In other words, Bruce Silver’s descriptive level of BPMN could be used for level 2 and the analytical level could be used for level 3. Other process architecture frameworks will add additional levels, even going up till the automation of the process using a BPM Suite.
On a side note, there is also the question of the usefulness of process architectures. To assess this usefulness and to decide how to use such a process architecture, Alan Ramias of Performance Design Lab offers the following rules of thumb:
- Don't create a process architecture just because you think you're supposed to have one. Its usefulness is most evident when applied for making a change. The larger and more complex the change, the more insight an architecture might give you.
- Consider the model to be “throw-away” work once the project is done, unless you are really going to put effort and resources into maintaining it as part of a process library.
- Service organizations might benefit greatly from a process architecture perspective, in helping them to define and understand all of the work they do.
- The greatest opportunity for process improvement is not at the single process level but at the level of multiple processes, where interactions between processes and participating organizations tend to be poorly understood and managed.
Chapter 3 focuses on the different elements of the BPMN syntax. I wouldn’t bother with this chapter if you have already mastered Bruce Silver’s BPMN: Method & Style. The chapter does remind us that there are two main purposes for business process modeling: organizational design and application systems design. The business process has a business oriented AND an IT oriented aspect. It also reminded me of some definitions that I seldom use, but are used throughout the BPM community: A BPMN diagram featuring more than one pool is called a collaboration diagram, and an empty pool is called a public process or black-box process. The opposite of this being a white-box process or private process, only showing the interaction with for example a client, but not the steps this client lane undertakes in the greater scheme of things. Chapter 4 continues the elaboration of the BPMN syntax by going into the more complex concepts, such as intermediate events and subprocesses.
Process discovery is the next step in the life cycle, and is split up into four phases: Defining the setting (assembling the team that will work on a process), gathering information (building understanding of the process), conducting the modeling task, and assuring the process model quality. This phase will be dominated by three challenges: fragmented process knowledge, thinking in cases (or anecdotal information) and lack of familiarity with the chosen process modeling language.
Once a proper team has been gathered that can tackle the challenges of the previous paragraph, the information gathering about the process can be handled using different methods:
- Evidence-Based Discovery: For example document analysis, observation through “walking the process” where the analyst physically follows the process, or process mining/automatic process discovery.
- Interview-Based Discovery: interviewing domain experts on the execution of a process.
- Workshop-Based Discovery: getting all contributors in a discussion about the execution of the process.
Each of these has its strengths and weaknesses as shown in the table below:
| Aspect | Evidence | Interview | Workshop |
|---|---|---|---|
| Objectivity | high | medium-high | medium-high |
| Richness | medium | high | high |
| Time Consumption | low-medium | medium | medium |
| Immediacy of Feedback | low | high | high |
Once all information has been gathered, the process is modeled by identifying the process boundaries, activities and events, resources and handovers, control flow and any additional elements (such as data objects and associations) that might be needed. As the book focusses heavily on BPMN, these elements to identify are somewhat leading towards this modeling language. This modeled process should then be put through quality assurance. The figure to the right shows the different aspects of quality that should be taken into account.
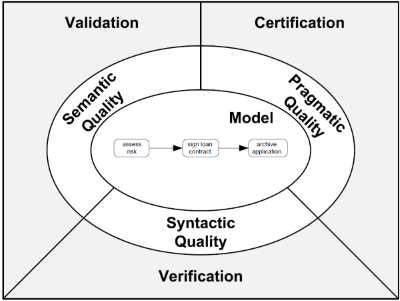
Syntactic Quality is measured in the adherence to the syntax for the chosen modeling language. Semantic Quality is verifies whether the process makes true statements about the considered domain, and whether they are relevant to the problem to be addressed by the process. It should also verify for completeness of the process. This is done by validating the process model against the real-world business process. Pragmatic quality is about the usability of the process, and the estimated use the new process will have once deployed. The components of understandability, maintainability and learning also relate to this quality topic. The book also offers several guidelines for proper modeling, most notable of which the Seven Process Modeling Guidelines (7PMG). One topic the book doesn’t mention is the process compliance: the extent to which the process adheres to third party standards such as any particular ISO, or Sarbanes-Oxley (SOX).
In order to improve a process, a measure of the current quality of the process needs to be established. For this we proceed to the next step in the life cycle: The process analysis. This analysis can be (and needs to be) done both qualitatively and quantitatively. Each of these has its proper techniques and best practices. Chapter 6 dives into the former and chapter 7 into the latter.
Qualitative analysis has a number of techniques associated with it. The first to be discussed in the book is Value-Added Analysis. This technique wants to identify unnecessary steps (either a task in the process or a handover between tasks) in order to eliminate them afterwards. It thus consists of two stages: value classification and waste elimination. The value classification is to assign to each step the value it adds and label it accordingly as Value Adding for the customer (VA), Business-Value Adding (BVA) in order for business to run smoothly and Non-Value Adding (NVA). Next comes the elimination, which as a general rule should strive to minimize the NVA tasks through for example automation.
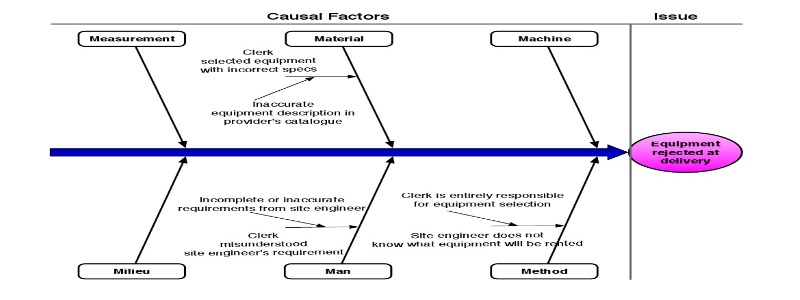
Another technique would be Root Cause Analysis. This works on the principle that even a good process could be better. There are always points at which the process could be improved. Cause-Effect Diagrams are a tool with which to show any given negative effect of the process and its causes. Causes (also called factors) can be either causal or contributing to this effect. A well-known categorization of the different types of causes is the 6M category set (Machine, Method, Material, Man, Measurement, and Milieu). These diagrams typically take the form of an Ishikawa or Fishbone diagram (as shown below). A different way of portraying this information is a Why-Why diagram (or tree diagram).
Once the issues have been determined, we need to document them and assess their impact on the process. In order to properly document them, the issue register gathers the output of the root cause analysis with a more detailed analysis of the individual issues and their impact. Typically it specifies the name of the issue, a description, the priority, any assumptions (or input data), as well as the qualitative and quantitative impact. The impact analysis will then be used as input for the Pareto analysis. Here we identify the issues to give priority based on the principle that a small number of factors are responsible for the lion share of issues. Complementary to the Pareto charts are the PICK charts, adding the dimension of difficulty to execute to the analysis. It divides the issues into 4 quadrants: Possible (low payoff & easy to do), Implement (high payoff & easy to do), Challenge (high payoff & hard to do), and Kill (low payoff, hard to do).
A little side note to the analysis techniques in the book: When concentrating on the common and statistically relevant (such as with a Pareto Analysis), we disregard the exceptional cases. And when performance is exceptional, this can be positively or negatively exceptional. Positive Deviance Analysis looks at those exceptional cases to determine the vital behaviors or characteristics of a process instance that went exceptionally well in an attempt to duplicate these results and make the exceptional case the new mean. This technique was first used in the 1990’s in the field of human nutrition, where it was noticed that neighborhoods that were better nourished achieved more academic acclaim than others, giving insight in how to improve nutrition across neighborhoods.
Quantitative Process Analysis (chapter 7) is made up of a plethora of techniques in order to provide a solid basis for decision making. It focused primarily on performance measures such as cycle time, total waiting time, cost… These performance measures play in four distinct dimensions: time, cost, quality and adaptability (the performance of the process under changing conditions). There are several reference models and industry benchmarks such as the Balanced Score Card, APQC’s Process Classification Framework and the Supply Chain Operations Reference Model (SCOR).
The first of the quantitative techniques in the book is Flow Analysis, a technique aimed at estimating the overall performance of a process as the sum of the performances of each individual step in that process. It usually calculates average cycle time (elapsed time between the start and end of a process). Depending on the structure of the process (more specifically how it branches into alternative execution paths), the book introduces us to the techniques on how to calculate the process time of each individual step and how to make a weighted sum of these process times. As a second indicator, it also provides formulae to determine cycle time efficiency, determining the ratio between waiting time and processing time. This comes down to the theoretical cycle time divided by the actual cycle time. The technique is rounded with the measures of arrival rate (the average number of new process instances per time unit) and Work-In-Process (the average number of active instances at any given time). Together with the previous cycle time measure they form Little’s Law (Supply Chain Management): WIP = Arrival Time * Cycle Time. Although providing several interesting measures, there are several difficulties with this technique, of which the main roadblock is the need for estimating each individual task/step. Another is the phenomenon of resource contention (more work needing doing than there are resources available to do it causing waiting time to be bigger). The technique does not take into account the fact that a process behaves differently depending on the load (number of process instances active).
Queueing Theory (QT) is another quantitative methodology in which a system is seen as a collection of queues and services provided by one or more servers. Depending on the context, these queues handle jobs or customers. QT consists of numerous techniques of which the book handles only a few. A limitation of these techniques is they deal with only one activity at a time and thus are unsuited for analyzing a complete process (consisting of multiple activities and branches). Some well-known concepts of QT are the following:
- A Poisson (exponential distribution) Process charts the arrival process of new instances of jobs or arrivals of new customers.
- M/M/1 (Single Queue) and M/M/c (Model with c amount of servers) Models: Models describing arrival time in FIFO servers and a Markovian (or exponential) distribution.
The third quantitative technique discussed in the book is Process Simulation. This comes down to generating a large number of instances (randomized or semi-randomized), letting these instances execute each of their steps, monitoring these executions, and then drawing conclusions from the gathered data. Typically entries in these types of data sets have an identifier, and three timestamps: the time when a task was ready to be executed, the time when a task was started, the time when a task was completed. This way previously discussed measurements such as waiting times can be approximated. There are different tools on the market for these types of analyses.
I would like to point out some common measures that can be taken into account, and are again not mentioned in the book, which originate mostly from the world of supply chain management:
- Process Efficiency: measure of the inputs and resources consumed by the process versus established standards.
- Supplier Effectiveness: measure of the supplier performance to specified parameters.
- Product Cost: measure of the total cost to execute the process to its end, including inputs, processing and resource costs.
Once we have metrics, we move into the life cycle step of process redesign. Chapter 8 is dedicated to this topic. There are two compelling reasons why we redesign existing processes: First, organizations have an organic nature, changing over time. Business processes tend to evolve to match this new business reality in a similar organic way. Second, the world around us changes, forcing the adaptation of our processes to these changes as well. Not trying to come up with an all-purpose definition of what process redesign is (every change in a process can be considered redesign), the author identifies the 7 most important aspects of redesign:
- The customers (internal or external) customers of the process.
- The business process operation view: what steps make up the business process?
- The business process behavior view: how a process is executed, meaning in which order the steps are executed, and how these steps are scheduled and assigned for execution.
- The organizational structure and the participants (organizational population) in the process.
- The information used and being created.
- The technologies the process uses (and in extension the technologies used to implement the process itself).
- The external environment the process is situated in.
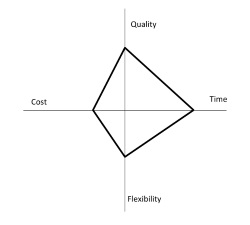
In order to graph the goals of the process redesign effort we can construct a Devil’s Quadrangle, which utilizes the performance dimensions of chapter 7. Ideally, a new process will decrease time required to execute, lower the cost, improve the quality and increase the ability of the process to deal with change or variation.
The various methodologies for process redesign can be differentiated based on two primary criteria: the intensity (the pace at which the change to the process needs to happen) and the starting point of the redesign effort, which is either from scratch, from the traits of the existing process, or from an reference model indicating an industry standard. The redesign process chosen by the author to describe is the Heuristic Process Redesign. This methodology is divided into 3 fairly self-evident stages: Initiate (where the redesign project setup takes place based on the available metrics and the as-is documentation), Design (use a fixed list of redesign heuristics to stipulate potential improvement actions/redesign scenarios, and to determine which to act upon) and Execute (evaluate the redesign scenarios based on quantitative analysis and stakeholder workshops and execute or reject the proposals). The book then explains the heuristics for redesign, one for each of the seven aspects mentioned earlier.
It also briefly covers product-based design as an alternative to the heuristic method. Here the core idea is to completely ignore the existing process and instead focus on the outcome and thee leanest possible way to achieve that outcome. However, as the core idea already demonstrates, this technique is heavily geared towards processes that produce informational products (decisions, proposals, permits…) and as such its product data model shares several characteristics with the Bill-of-Materials from Supply Chain Management.
Normally, the next step in the life cycle is process implementation. Chapter 9 covers one flavor of this, namely the use of a Business Process Management System (BPMS) to automate the processes or in fact any part of the procedural work contained within it. The BPMS aims to coordinate the automated process so that the work is done by the proper resource at the proper time. For this, it exploits the explicit description of the process (since BPMN is an executable syntax) as opposed to Workflow Management Systems such as CRM or ERP packages. More on this can be read in Howard Smith and Peter Fingar’s book “Business Process Management - The Third Wave”.
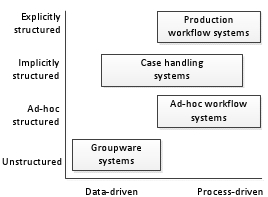
The spectrum of BPMS engines can be divvied up into 4 distinct flavors:
- Groupware systems: Allowing the users to easily share information and documents with each other (for example Lotus Notes)
- Ad-hoc workflow systems: On-the-fly process definitions can be created and modified (for example TIBCO’s BusinessWorks)
- Production workflow systems: Work is routed strictly based on an explicity defined workflow (for example IBM’s Process Manager)
- Case handling systems (also known as Adaptive Case Management systems): Implicit models are used which capture conventional flows from which a user can deviate (for example BPMOne by Perceptive Software)
We can also divide up the BPMS engines taking into consideration their adherence to the BPMN standard: Pure BPMN (natively true to the syntax), Adapted BPMN (a BPMN skin over another workflow engine), and Non BPMN (supporting other descriptive syntaxes such as BPEL).
There are many advantages to automating processes with any type of BPMS such as workload reduction, flexible system integration, execution transparency and rule enforcement. For example, workload reduction occurs through the automatic dispatching of work, coordination between different knowledge workers, and the gathering of all relevant information to execute the task, all of which are time-consuming tasks when performed manually. Execution transparency is achieved by the BPMS performing the administration for all operational and historical information surrounding process instances. Both flexible integration with other software components and the enforcement of rules baked into the process design come as standard functionalities of any BPMS tool worth its salt.
As with any other component or design pattern, a BPMS also has its drawback. These challenges can be technical (such as the lack of proper documentation to determine the triggers for starting an automated process or the information interchange between the BPMS and other systems), and organizational challenges (balancing the sometimes conflicting performance requirements of all stakeholders, or their reluctance to shift to such a way of working, especially in organizations that have the maturity of a cult of heroes).
Returning to Bruce Silver’s BPMN levels, we now move to the executable model. In order to make our process executable, these are the steps to be taken in an incremental fashion: Identify the automation borders, review the manual tasks, complete the process model, bring the model to an adequate level of granularity and specify the execution properties. When reviewing the manual tasks, bear in mind the two different flavors of process instances. Explicit process instances are triggered by the action of a person (such as clicking a button on a submit form), and implicit instances are automatically triggered by an event (such as a periodic timer or an incoming message). In order to determine the adequate granularity, we apply aggregation to join tasks together to a single task, or we apply disaggregation to split them up.
The final chapter is on Process Intelligence: Gathering data about process execution and analysis of this data. If this is to be done in an intelligent manner, this data (typically parsed event logs of relevant applications) needs to be structured to suit the needs of execution analysis methods such as process mining. The MOOC taught by Professor Wil van der Aalst is well worth checking out. The analysis focuses on three objectives: transparency, performance and conformance. When looking at event logs on an aggregated level, it is called process controlling. When looking at them on an individual level, it is called process monitoring. The chapter also goes into detail on techniques such as the α-algorithm, but looking into that would take this review a bit too far, and is also a topic of the aforementioned MOOC.
There are some challenges to correctly extracting and parsing the event logs:
- Correlation challenge: Identifying which case/process instance an individual event belongs to.
- Timestamp challenge: Log timestamps might not be representative of the execution time as logging might be delayed until system idle time
- Snapshots challenge: With long running processes not all data might be available yet, or old data might have already been archived/deleted.
- Scoping challenge: Some systems might not produce the logs in a usable fashion, so they might have to be extrapolated or inferred.
- Granularity challenge: the granularity of the logs might not correspond to our process design.
Upon concluding this review, it seems to me that this is a book that sets out to introduce its reader to the world of BPM from a beginner perspective. It wants to briefly touch all fields within the discipline in order to generate enthusiasm, and it succeeds wonderfully at this task. I would advise any person starting in this discipline to read it with great care.
| Review | BPM |