A Need to Know
12th of December 2015When I started this data dream quest in the first article of the series, I stated the current state of affairs of most enterprises (for example the organic evolution of their data stores). But this is just the state of data within the boundaries of the enterprise. The outside world is also shaping the realities of data management. Data is omnipresent, and growing at an accelerated rate. Some indicators exist that 90% of all data available at this point, was generated in the last two years. Not only does the volume increase, but also other factors, such as the number of sources, variety, velocity and data formats. This translates to the four main drivers of Big Data, as shown in the illustration below.
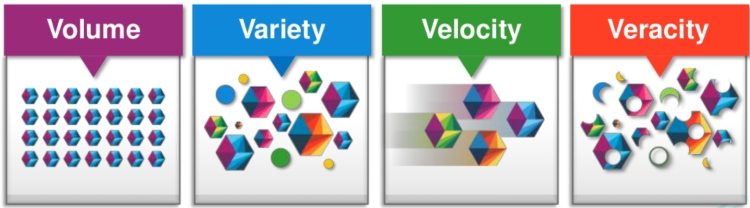
These drivers lead to complications for the enterprise wanting to use the information available to it. Data becomes untrustworthy, hindering the ability of users to rely on the data for creating business insights and for taking information decisions. This may arrive from unexplained reporting inconsistencies, or having a multitude of definitions for the same business entity, each with their own level of quality. It can also render said data inaccessible, or at least overly complicated to get to, through a multitude of channels, as well as the different types of consumers.
Governance of this information plays a big part in Enterprise Information Management. If we take the definition of the Data Governance Institute:
This indicates that data governance is not only the management of data, access points to this data, and the management of metadata, but is also the process of ensuring that the data aligns with the corporate strategy.
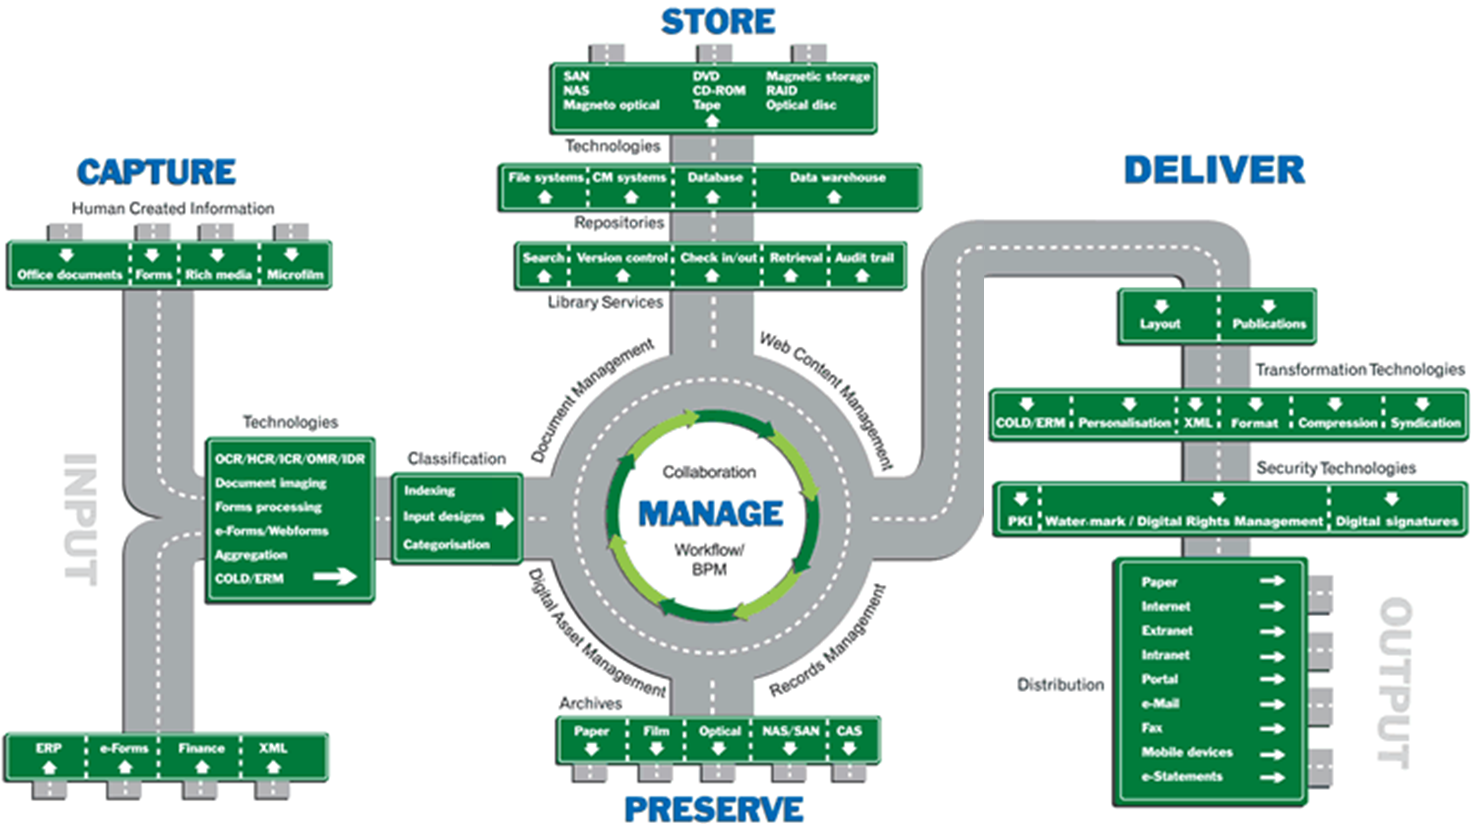
A big part of these agreed-upon models will shape the information lifecycle management exercise, specifying and enabling the inputs, capturing this data from different channels, storing and preserving it in archives, delivering it to the proper consumers, and have a purging approach in play. A graphical representation can be seen in the illustration taken from the AAIM website.
Worst case scenario, the latency of data processed is so low that dirty data has an impact on the timeframes in which proper governance policies can be applied. This has led to such concepts as Good Enough Governance (GEG), stating a minimum of governance required before data can be considered useful for business purposes. This minimum is determined with following characteristics:
- Context/Potential Use
- Risk versus Reward Ratio
- Regulatory Requirements
- The Right Place to apply governance
- The Right Time to apply governance
When storing data for purposes other than live usage, several types of stores are possible. This distinction is not based on structure, but rather on designated purpose. We will discuss three possibilities in the next few paragraphs, namely Operational Data Stores (ODS), Data Marts and Data Warehouses. Each of these has a primary reporting oriented purpose, as well as being a tool for information provisioning.
An ODS is a copy of one or multiple operational databases, used for either operational reporting or performance requirements (for example support for ad hoc reporting or performance draining queries). Its nature is subject-oriented, with a minimal latency to support tactical decision making. A Data Mart is a collection of data, generally collected from a number of systems to capture the state of business processes. They are basically data warehouses with a limited scope (for example limited to a single department). Data Warehouses are the primary storehouse for cleansed, transformed, and consolidated historical data in order to provide consumers with a time-based, aggregated view of cross-functional data.
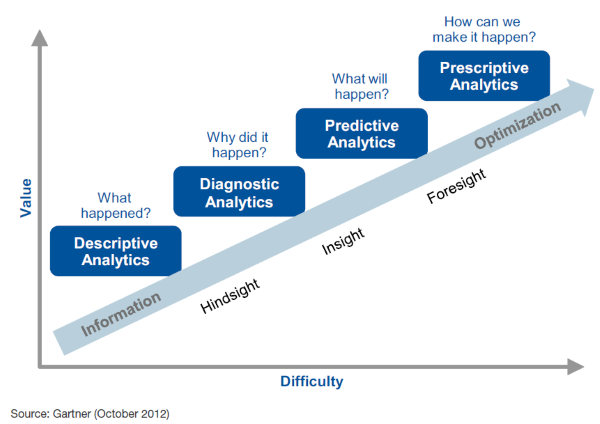
In order to grasp the reporting purpose discussed, I posit here the 4 levels of analytics as shown in the illustration of the Analytic Ascendency Model of Gartner. The lowest level is Descriptive Analytics, which uses available data to understand the past and current situation of the enterprise. Somewhat more advanced is Diagnostic Analytics. This is a form of advance analytics which examines data or content to answer the question “Why did it happen?”, and is characterized by techniques such as drill-down, data discovery, data mining and correlations. Next up is Predictive Analytics, where an attempt is made to predict the future situation of the enterprise using tools and mathematical techniques (for example trends analysis, pattern matching, correlation and simulation). Finally, Prescriptive Analytics is used to optimize business processes and operations based on the insights gleaned from the predictive level.
Fari Payandeh wrote a very illuminating example of the different categories of analytics in his article “BI vs. Big Data vs. Data Analytics by Example”. The following paragraphs are an excerpt of this article.
Let’s say I work for the Center for Disease Control and my job is to analyze the data gathered from around the country to improve our response time during flu season. Suppose we want to know about the geographical spread of flu for the last winter (2012). We run some BI reports and it tells us that the state of New York had the most outbreaks. Knowing that information we might want to better prepare the state for the next winter. These types of queries examine past events, are most widely used, and fall under the Descriptive Analytics category.
Now, we just purchased an interactive visualization tool and I am looking at the map of the United States depicting the concentration of flu in different states for the last winter. I click on a button to display the vaccine distribution. There it is; I visually detected a direct correlation between the intensity of flu outbreak with the late shipment of vaccines. I noticed that the shipments of vaccine for the state of New York were delayed last year. This gives me a clue to further investigate the case to determine if the correlation is causal. This type of analysis falls under Diagnostic Analytics (discovery).
We go to the next phase which is Predictive Analytics. PA is what most people in the industry refer to as Data Analytics. It gives us the probability of different outcomes and it is future-oriented. The US banks have been using it for things like fraud detection. The process of distilling intelligence is more complex and it requires techniques like Statistical Modeling. Back to our examples, I hire a Data Scientist to help me create a model and apply the data to the model in order to identify causal relationships and correlations as they relate to the spread of flu for the winter of 2013. Note that we are now taking about the future. I can use my visualization tool to play around with some variables such as demand, vaccine production rate, quantity… to weight the pluses and minuses of different decisions insofar as how to prepare and tackle the potential problems in the coming months.
The last phase is the Prescriptive Analytics and that is to integrate our tried-and-true predictive models into our repeatable processes to yield desired outcomes. An automated risk reduction system based on real-time data received from the sensors in a factory would be a good example of its use case.
A final level is added by Manan Goel in his article “The Art of the Possible with Business Analytics” posted on the Oracle Business Intelligence Blog in 2012. This level, dubbed Exploratory Analytics is about leveraging complex and varied data for information discovery. It is a level for dealing with questions containing a lot of doubt and ambiguity in order to detect new business opportunities, cause and effect hypothesis testing, and advanced forms of root cause analysis.
Now that the conceptual stuff has been appropriated, we move to a more logical view of the architectural style.
| Thought | EIM |